
How much is one second – performance tests

Have you ever wondered what one second means, what can happen in it and what effect it can have on our lives?
For each of us, a second can mean something different. For an athlete, one second can be decisive in winning or breaking a record. Being late a second, we may not be able to get on the subway train, it may also save us from an accident on the road.
It’s hard to say exactly what one second is, since 20 May 2019 the International Institute of Weights and Measures defines it as follows:

Second, the symbol ?s?, is the time unit in the SI system. It is defined by the accept of a fixed numerical value of the frequency of cesium, it means the frequency of hyperfine transition in the atoms of cesium 133 in undisturbed basic condition amounting 9 192 631 770 expressed in units of Hz which is equal to s-1.
Sounds quite abstract, but in everyday life we don’t need such accurate measurements.
However, single seconds are very important in the IT world. Especially when the user is waiting for a page to load or a specific interaction in the application.
A number of studies have been conducted on the perception of websites and stores by Internet users. By definition, the Internet users are very impatient, waiting for a page to be loaded for more than 4 seconds causes nearly 25% of the respondents to leave the site (Kissmetrics):
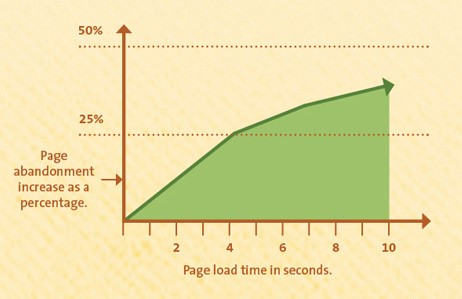
Following this path, the above situation translates into a drop in sales in Internet shops or a perception of a given brand through the prism of its main page. The results of these studies have shown that nearly 47% of users expect the time of loading websites to not exceed 2 seconds.
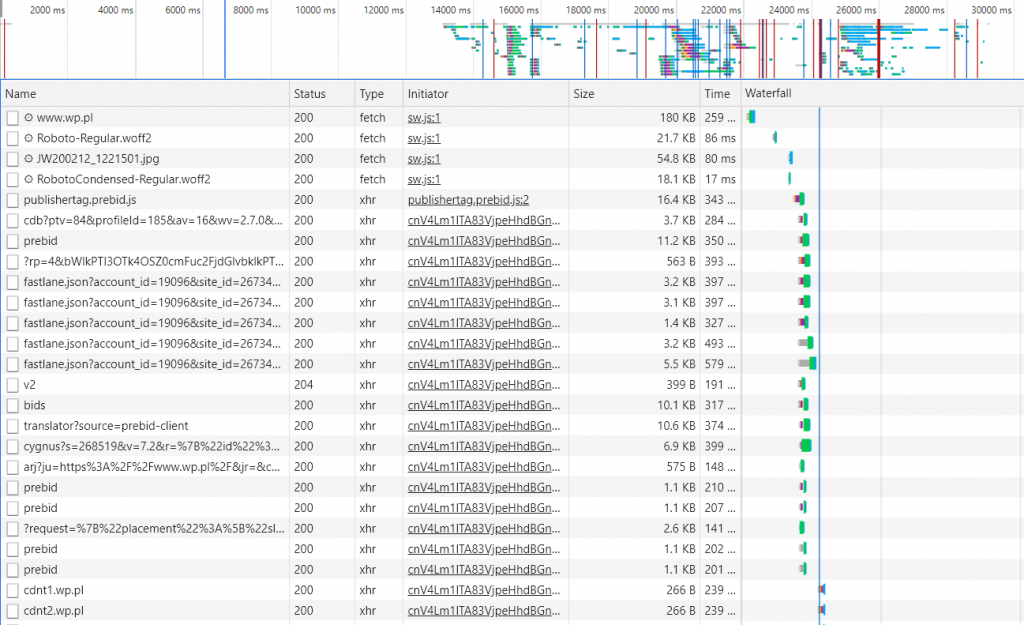
To check how long a page is loaded, you can use DevTools option (F12 in each browser). An example screenshot of the wp.pl website below. Here you can see all queries that are executed after starting the main page.
How to speed up the application? You can use ready-to-use tools that will check the performance of your website and suggest appropriate steps to accelerate it. The most popular one is PageSpeed Insights, a tool from Google that measures the performance of page loading. This report allows you to diagnose technical problems with the site as well as with its construction. The obtained result is on a 100-point scale – the bigger the better. The report is based on pages loaded on mobile and stationary devices.
Another very popular tool is Mobile-Friendly Test. The tool checks the application for performance on mobile devices and prepares a report on website performance. It verifies the completeness of the page loading and indicates the resources that could not be loaded.

Also noteworthy is the Pingdom Speed tool. Similarly, to Google’s tool, it generates a report with information about the possibility of optimizing the site. In addition, in Pingdom Speed you can indicate the location from which the test is performed, e.g. Australia or Brazil.
Some tools, such as GTmetrix, in addition to preparing a report, also allow exporting the report to a PDF file that can be sent, for example to a client.
The above tools offer a number of solutions that can improve the performance of the website/shop, but what if we have already used all the suggestions and applied all the good practices to speed up the pages and the application still responds slowly? Performance tests come to our aid, thanks to which we are able to check how the application works from the inside.

Performance tests belong to the group of non-functional tests and are performed to check the fulfilment of requirements such as the acceptable load response time, the number of process executions per unit of time, the number of parallel users who can use the system without losing performance loss. Performing such tests helps organizations to prevent application unavailability, which directly translates into company revenue.
Losses of companies as a result of failure of the application to work for a short time may reach millions of PLN. That is why it is so important to check the application for performance requirements.
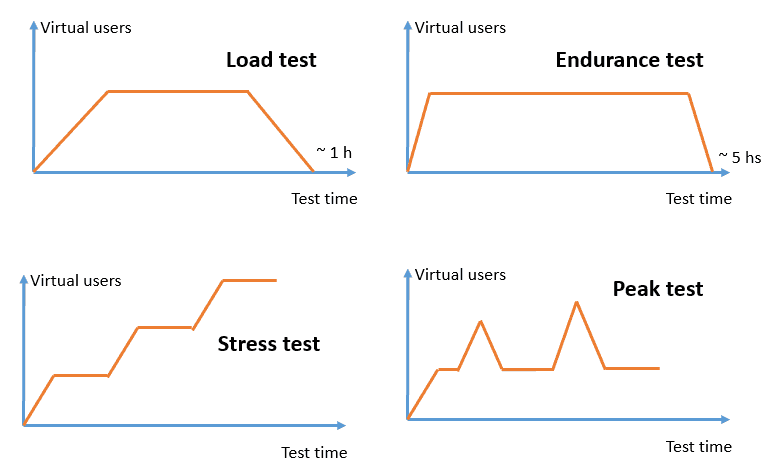
Performance tests are divided into different types and types, and the most common tests are the following:
- Load testing ? the most frequently performed tests to check the operation of an application under an assumed load. Performing such tests allows to determine the response times of the application and allows to find bottlenecks in the application, such as memory leaks, code errors (e.g. infinite loops, thread jamming) or errors related to the configuration of the application server or database.
- Stress testing ? Stress tests are designed to check the operation of an application with a load significantly exceeding the intended movement. System reactions under extreme conditions are tested.
- Endurance testing ? these tests verify the operation of the application under constant, long-lasting load, which may cause e.g. slow memory leaks.
- Peak testing ? Peak testing is used to simulate traffic in situations of increased traffic growth, e.g. during a promotional campaign.
To prepare performance tests we use, among others, the Apache JMeter application – a free tool written in Java. It is an advanced program for measuring the performance of static and dynamic elements, allowing to perform performance and overload tests. Thanks to a very large number of add-ons it is possible to prepare extensive test reports. Apart from JMeter there are also other open-source tools such as Grinder or Locust, but they do not provide as many possibilities as Apache JMeter.
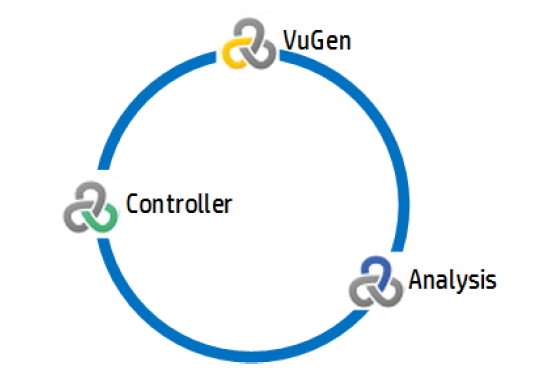
An alternative to open source tools are paid tools. Among performance tests, LoadRunner (which has been on the market for more than 20 years!) is in the first place, currently supplied by Micro Focus. The results of performance tests carried out using LoadRunner are very often used as a benchmark for other tools. LoadRunner consists of several components – VuGen (Virtual User Generator) to create test scripts, Controller to run tests, Analysis to prepare reports and analyze results and LoadGenerators to generate traffic during tests.
VuGen allows you to record a large number of protocols from HTTP to .NET, SAP, RDP, Web Services, Mobile Web and many more. You can add your own functions to the scripts, the scripts are created using C, JavaScript, C #, VB.NET and Java programming languages (depending on the selected protocol). LoadRunner integrates perfectly with other tools from the Micro Focus family, such as ALM, as well as with CI tools such as Jenkins. VuGen also integrates with the GitHub.
A single second in the IT world is very important. Even delays in the time of loading a page or application response can have a very negative impact on the users’ perception of a given portal/application and thus translate into financial results. Owners wanting to offer their customers an efficient and fast website or application should check it as accurately as possible in order to avoid losses or negative reactions of users.
Autor: Emil Użdziło, Performance/Automation Test Engineer